NOIR Part 2: Ordinal Measurements
An introduction into ordinal measurements, what they are, how and when to use them.

Measurement NOIR
This is the second in a series of four posts discussing the common measurement types used within social sciences. An easy acronym to help you remember the 4 measurement types is:
NOIR (No-are)
Today’s post will discuss ordinal measurements, what they are, how and when to use them. Identifying your data’s measurement type is an important step when deciding what type of statistical analyses can be done.
Speaking of NOIR, check out the top 10 Great Noir Films.
Ordinal Measurements

Downhill Skiing
As an example, the top 5 finishers from the 2018 Winter Olympics Men’s Downhill skiing are tabulated below. Downhill skiing is a timed event with faster times signifying better performance.
| Rank | Name |
|---|---|
| 1 | Aksel Lund Svindal |
| 2 | Kjetil Jansrud |
| 3 | Beat Feuz |
| 4 | Dominik Paris |
| 5 | Thomas Dreßen |
Based on the above tabulation, the order in which contestants finished the race is quickly recognized but how much time separated first from second place remains unknown. It’s possible first and second place were separated by milliseconds or seconds. This is also true for the differences between second and third place, third and fourth place, and so on…
You might be saying to yourself, “Just look at the times then.” It may be possible for this particular race, but what if you want to know how a contestant performs over multiple races on different courses? In this case, comparing times presents problems since course length, weather conditions, course difficulty, etc… may affect performance times. Looking at a participant’s rank order across multiple races provides a better indication of relative performance.
Survey Measurements
Psychological surveys often use ordinal measurements to capture participants’ opinions. These surveys present a statement followed by a set of fixed responses, an example question from a personality assessment is shown below:
| Strongly Disagree | Disagree | Neutral | Agree | Strongly Disagree | |
|---|---|---|---|---|---|
| I am the life of the party. |
These responses are ranked because Strongly Agree represents more agreement with the statement than Agree and certainly more than Strongly Disagree. However, the change in agreement from a response marked Strongly Disagree and one marked Disagree is unknown. It is also unclear if the change in agreement is constant between responses, i.e. Does a change from Disagree to Neutral represent the same amount of change in agreement as Agree to Strongly Agree?
The rulers below demonstrate two important concepts of ordinal measurements. First, the underlying measurements, e.g. time in downhill skiing or extroversion in personality, are continuous. Second, the method used to convert the continuous measurement into a discrete measurement can vary. Two possible choices are illustrated below, but keep in mind the number of possibilities are limitless.
If the decision rule is select the response closest to the measurement, then the cutoff for each response is exactly halfway between two consecutive responses. For the first ruler, this results in the same amount of distance on either side for each response. The second ruler, however, has a varying amount of distance. In other word, the distance between Strongly Disagree and Disagree is equal to the distance between Disagree and Neutral in the first ruler but unequal for the second. Both rulers represent possible realities when dealing with ordinal measurements.
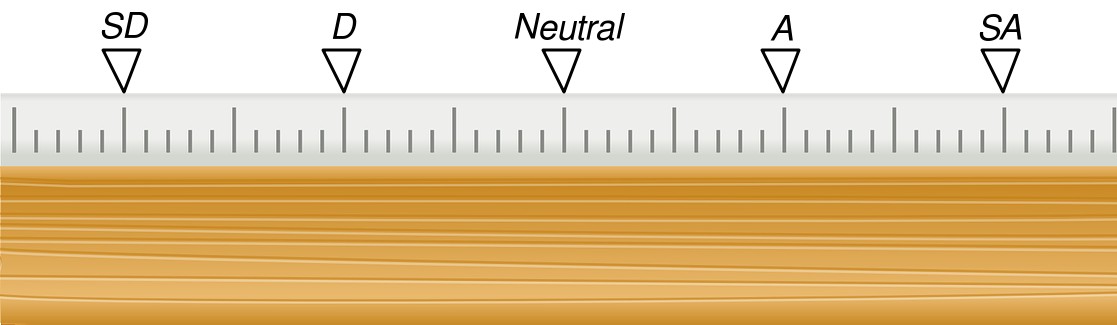
Above : Equal spacing between categories is often assumed but this is only one of many possible spacings for ordinal measurements.
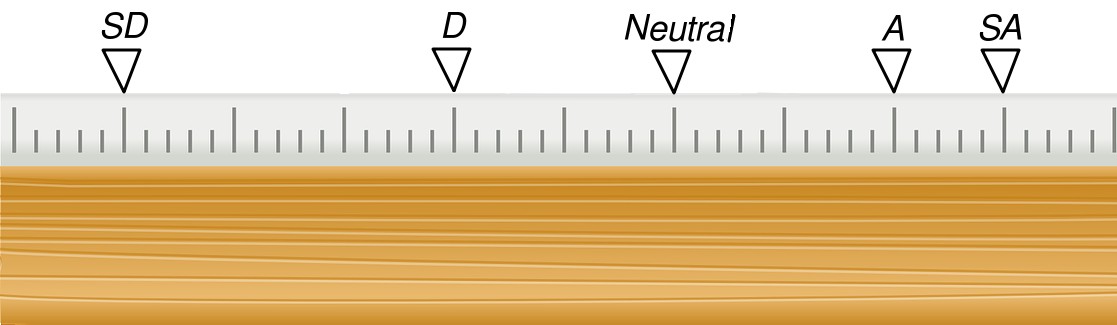
Above : Unequal spacing between categories is also a possibility with ordinal measurements.
Warning
A common practice with survey measurements is to assign a number to a response. In the above example, the value “1” is assigned to all responses which match Strongly Disagree, the value “2” is assigned to Disagree and so on. This gives the illusion that regular mathematical calculations can be done on ordinal measurements. But the value of assigning a number to a response is arbitrary as long as the order is maintained. It’s equally valid to assign “13.4” to Strongly Disagree and “17.65” to Disagree … Performing calculations, like addition or multiplication, will result in vastly different answers on the two examples above. When assigning numbers to ordinal measurements make sure to keep this in mind.
Analysis
Since ordinal measurements have a defined order, descriptions about the composition of the measurements can be performed. Sorting the data from lowest to highest and selecting the middle value tells you 50% (half) of the measurements are equal to or below this value. Similarly, 50% of the measurements are equal to or above this value. This middle value is called the median.
The measurement which appears the most (mode) is done in the same way it’s done for nominal measurements, i.e. selecting the category with the highest count.
As an example, imagine 7 participants answered the personality question listed above, a tabulation of the results would look like this:
| Participant | Answer |
|---|---|
| 1 | Strongly Disagree |
| 2 | Strongly Disagree |
| 3 | Strongly Disagree |
| 4 | Neutral |
| 5 | Agree |
| 6 | Agree |
| 7 | Strongly Agree |
The median answer is Neutral since it is the middle value after the data has been sorted in order. The most common answer (the mode) is Strongly Disagree since it appears most often, 3 times. Notice that these two descriptions, the median and the mode, are independent from any numerical values assigned to the measurements.
Review
Properties of ordinal measurements include:
- Defined Order
- Measurements can be classified as bigger/smaller, better/worse, stronger/weaker, etc. than other measurements and ordered accordingly.
- Difference is Unknown
- Measurements with different order are known to be different, but how different the two measurements are is unknown.
- Use the Median
- Sort the measurements in their natural order, from lowest to highest as an example, and select the value in the middle of the list. Half of the measurements are equal to or below this value, and half of the measurements are equal to or above this value.
GoFactr
Make sure to use GoFactr.com for all your research statistical needs. The online statistics program that computes descriptive statistics, ANOVAs, T-Tests, Linear and Logistic regression and Factor Analysis. No software to download means it runs conveniently from your tablet, chromebook, smartphone, laptop or desktop.